使用Grafana/Graphite优化Smokeping网络监控
主要是把整个优化过程的思路和大概的技术实现分享出来
第一:公司长期使用Smokeping监控机房的网络质量,Smokeping存在的问题:
- 页面速度慢,查问题效率低下
- 默认针对单个监控点的数据做展示,虽然也有MultiHost等,但也只是多个监控点数据的堆叠而已
- 多个机房部署,有多个URL链接,没有统一的查询入口
基本无法快速、直观地判断到底有没有网络问题,具体到哪些地区有网络问题
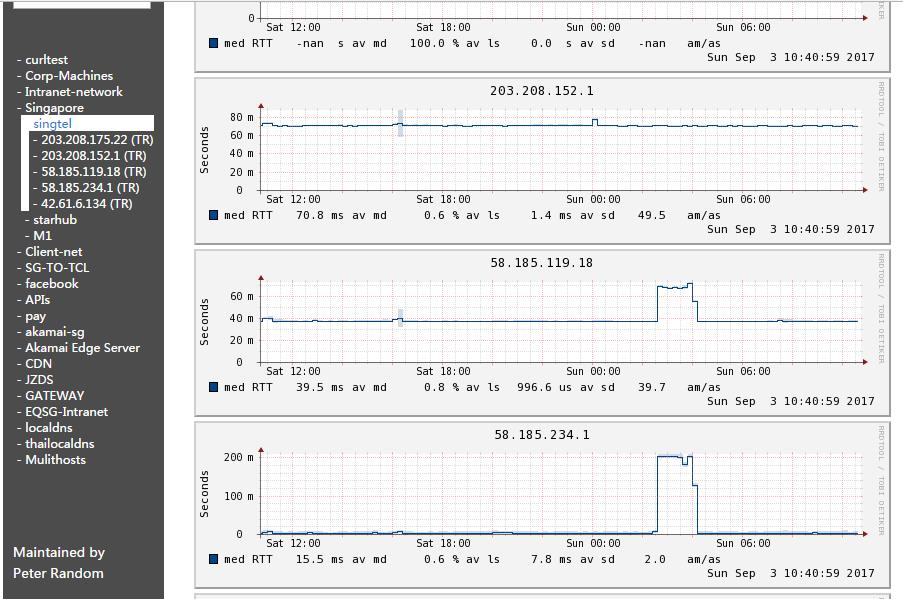
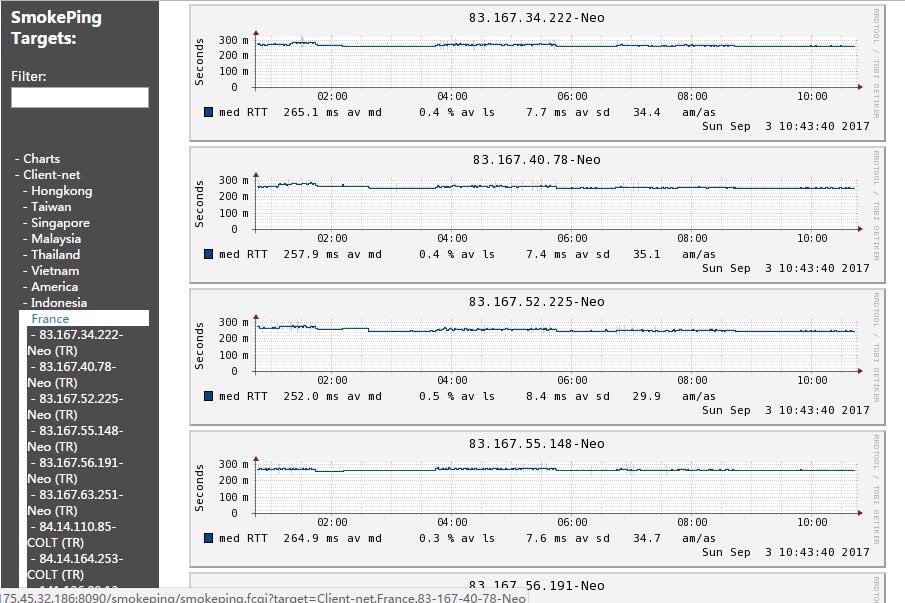
Smokeping日常使用如下图:
第二:优化目标(我们究竟想得到什么信息?):
- 要一眼能判断出哪些机房网络现在有问题
- 机房今天是否发生过网络问题,发生过多少次,以此来判断机房网络的稳定性
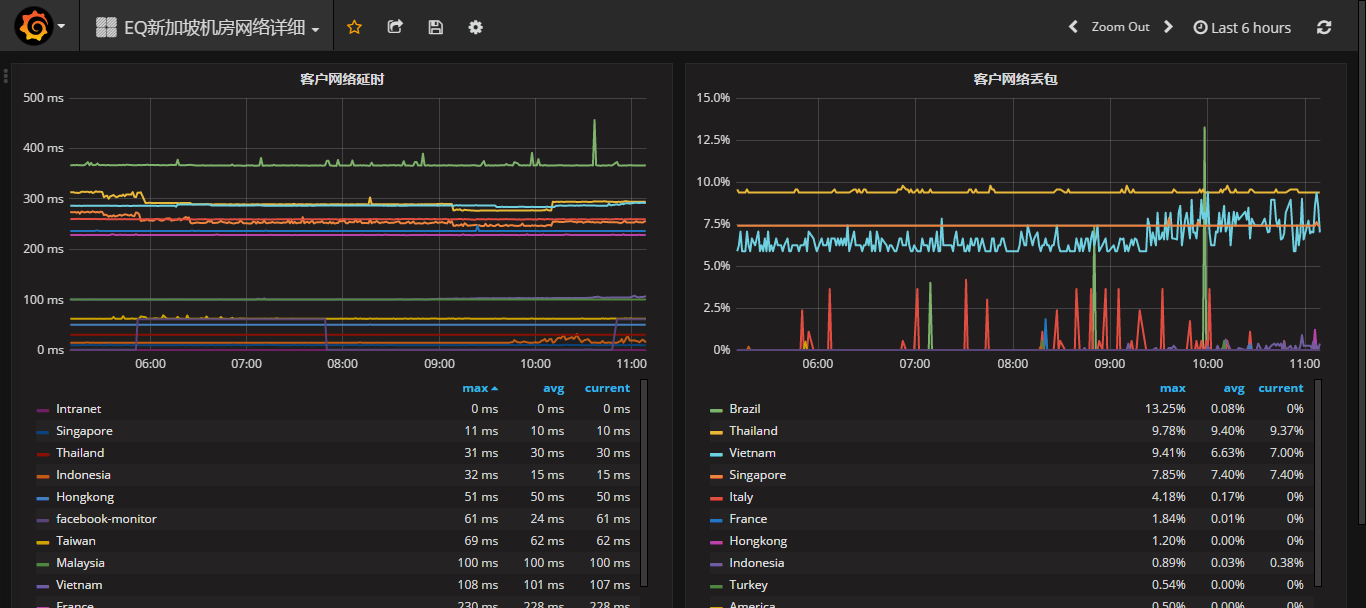
- 具体机房网络监控,按实际用户分布情况,按地区来展示,比如新加坡地区、泰国地区等
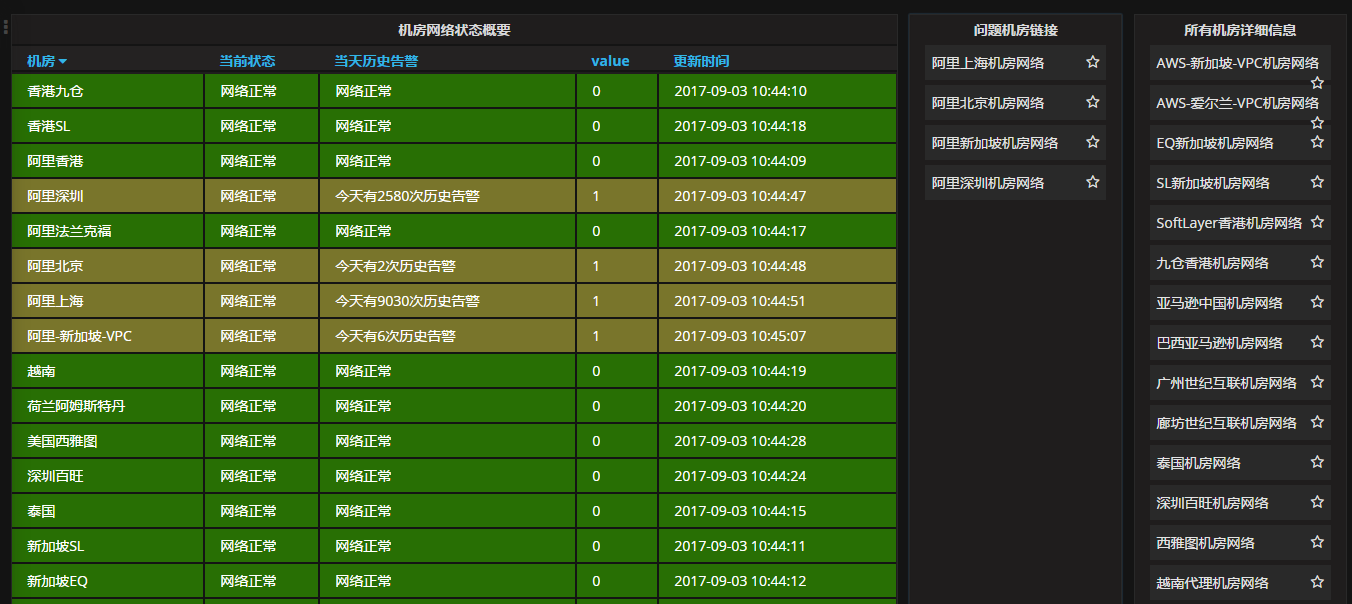
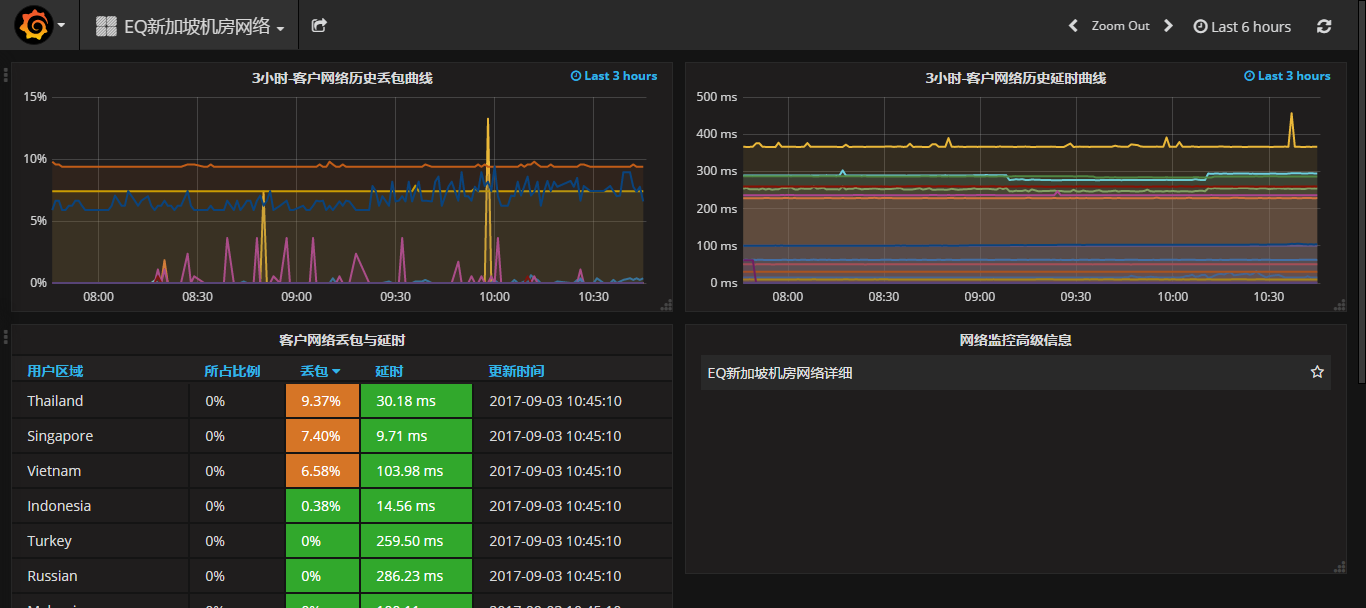
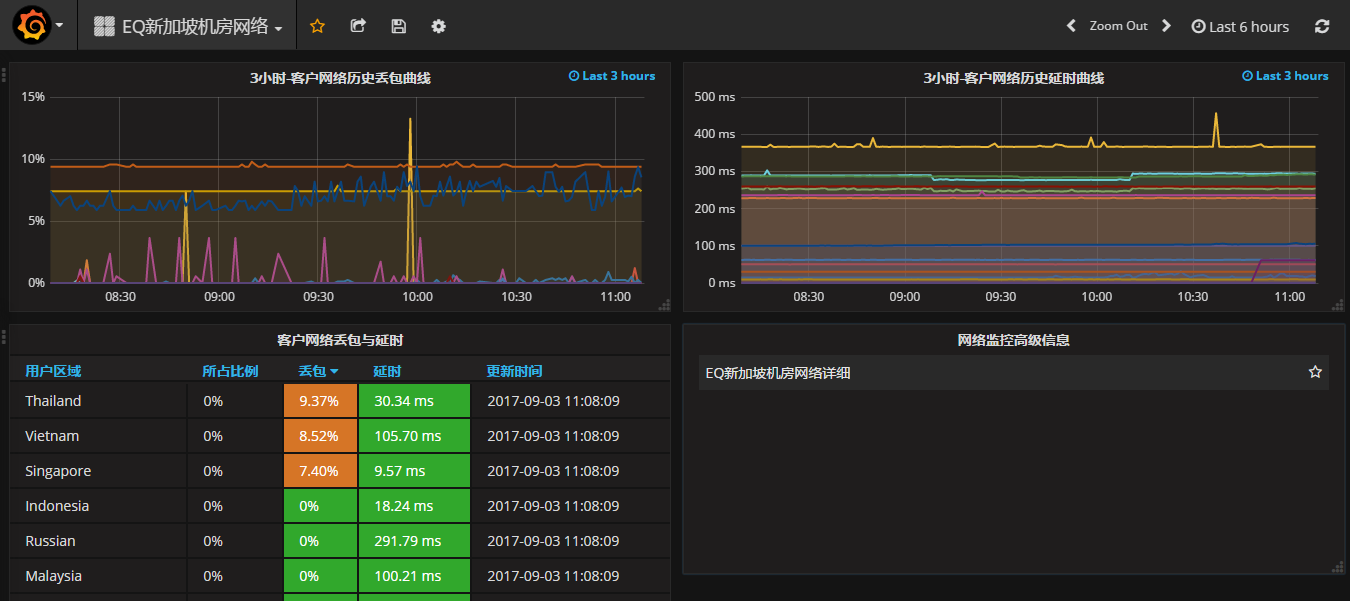
以下是基于Grafana的优化后的展示页面:
今天机房网络的整体情况,一目了然
每个机房按地区直观地反映出网络质量,以及该地区用户在机房覆盖用户的占比
第三:技术思路和方案:
- smokeping任然作为做基础的监控工具,主要用来搜集数据
- 使用python脚本,读取smokeping搜集的数据
- 使用Graphite按新的格式存储丢包和延迟数据
- 使用Grafana展示Graphite中的数据
第四:python读取smokeping数据
其实smokeping数据是存放在RRD文件中的,使用rrdtool package就可以顺利地读取出数据了 下面是我的示例代码,读取rrd文件,然后按照自己的规则判断是否有问题
def checkISP(parentdir,YunWeiUserList,YeWuUserList):
	thisIspName=os.path.basename(parentdir[0:-1])

	ispPtCnt = 0
	ispWnCnt = 0
	ispErCnt = 0

	warncnt = {}
	errcnt = {}
	chkptcnt = {}

	for subdir in os.listdir(parentdir):
		fulldirpath=os.path.join(parentdir, subdir)
		for rrdfile in os.listdir(fulldirpath):
			if rrdfile.endswith(".rrd"):
				ispPtCnt += 1
				if not chkptcnt.has_key(subdir):
					chkptcnt[subdir] = 1
				else:
					chkptcnt[subdir] += 1

				output=rrdtool.fetch(os.path.join(fulldirpath,rrdfile),'AVERAGE')

				for n in output[2][-3:-2]:
					if n[1] == None:
						continue

					if n[1] > 3: # above 15% packet loss
						print os.path.join(fulldirpath,rrdfile)
						print n[1]
						ispErCnt += 1
						if not errcnt.has_key(subdir):
							errcnt[subdir] = 1
						else:
							errcnt[subdir] += 1
					elif n[1] > 1: # above 10% packet loss
						print os.path.join(fulldirpath,rrdfile)
						print n[1]
						ispWnCnt += 1
						if not warncnt.has_key(subdir):
							warncnt[subdir] = 1
						else:
							warncnt[subdir] += 1
					else:
						continue


	ErrMsgSend=0 # only send the BIGGEST ErrMsg, and only send ONCE
	### statistic of problem node for each Province
	ErrProv=[]
	WarnProv=[]
	for subdir in chkptcnt.keys():
		print "\tProvince : %s" % subdir
		print "\t\tAll province check point is %d" % chkptcnt[subdir]
		if errcnt.has_key(subdir) and not ErrMsgSend:
			print "\t\tErr Count Number is %d" % errcnt[subdir]
			if errcnt[subdir] / chkptcnt[subdir] > 0.65:
				print "\t\t\t !!! %s has error bad network" % subdir
				ErrProv.append(subdir)
		if warncnt.has_key(subdir) and not ErrMsgSend:
			print "\t\tWarn Count Number is %d" % warncnt[subdir]
			if warncnt[subdir] / chkptcnt[subdir] > 0.65:
				print "\t\t\t !!! %s has warning bad network" % subdir
				WarnProv.append(subdir)
关键就是下面这一行代码:
output=rrdtool.fetch(os.path.join(fulldirpath,rrdfile),'AVERAGE')
第五:数据存入Graphite中
按自己的定的规则,自定义数据存储路径,方便使用Grafana的模板 比如我就是按以下路径存储smokeping数据到Graphite中
*NETWORk.\{\{机房名\}\}.\{\{监控类别\}\}.\{\{监控点分类\}\}.\{\{监控点ip\}\}*
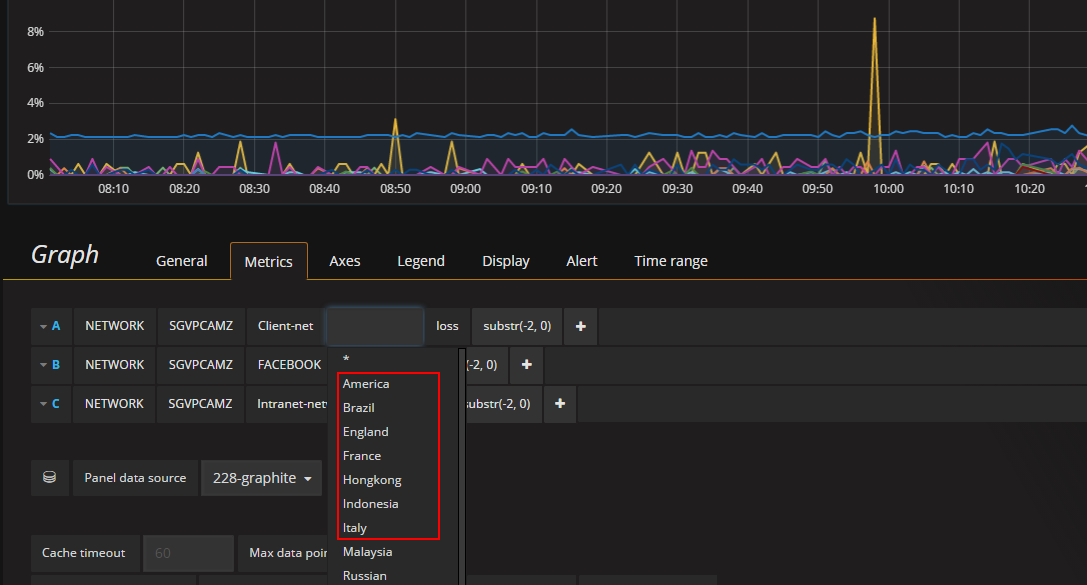
第六:最后是Grafana配置模板,展示我们存储在Graphite中的数据
展示最近3小时的网络数据,毕竟我们最主要关心的是近期的网络质量情况:
想看其他时间段的数据?没问题,另外来一个模板,查看任意时长的网络数据:
- 08 Sep 2017 » 前一篇:Docker HEALTHCHECK健康检查及注意事项
- 02 Sep 2017 » 后一篇:python编写Prometheus exporter获取redis自定义数据